Looking for a new opportunity as DevOps engineer
I am currently seeking a new opportunity as a DevOps Engineer, available from February 2026. I am open to remote or hybrid work from Prague, Czechia (Europe), for a long-term, full-time position or B2B contract - 300 EUR / daily. Please feel free to contact me for further details. You can also review my professional background on my LinkedIn profile.
Loki, Promtail and Syslog
On my home server, I was slowly getting annoyed that I didn’t really have an idea of what was happening in the syslog, and when an application, for example, throws an Out of memory error, I simply don’t know about it. That’s why I decided to send syslog to Promtail, which pushes it to Loki (Grafana) and processes it.
The first thing is how to send syslog to Promtail. This is done by editing the file /etc/rsyslog.d/promtail.conf, at least on Ubuntu.
*.* action(type="omfwd" target="promtail-syslog.default.svc.cluster.local" port="1514" protocol="tcp" Template="RSYSLOG_SyslogProtocol23Format")
Here you can see that I’m sending the entire syslog to my syslog service in Kubernetes (yes, my DNS is set up so that I can send directly to cluster domains from Linux) on port 1514. I’d like to mention here that it’s important for the file to have the .conf extension, and after editing, you should restart the service
sudo systemctl restart syslog
The next thing is editing the promtail.yaml file. I struggled with this a bit because I have Promtail in Kubernetes, I think it was installed with Loki, and it wasn’t installed as a deployment (so I really couldn’t find it), but as a daemonset, which I found out after a necessary dose of searching. To make things more complicated, the yaml file is stored in secrets instead of configmaps, but oh well. So I added this to the file
- job_name: syslog
    syslog:
      listen_address: 0.0.0.0:1514
      idle_timeout: 60s
      label_structured_data: yes
    relabel_configs:
      # Static label to ensure at least one label exists
      - target_label: job
        replacement: syslog
      # Dynamic labels from syslog fields
      - source_labels: ['__syslog_message_hostname']
        target_label: host
      - source_labels: ['__syslog_message_appname']
        target_label: app
      - source_labels: ['__syslog_message_severity']
        target_label: level
Finally, I created a syslog service in Kubernetes for Promtail, where I send the data, but I won’t describe that here, since everyone will probably do it their own way.
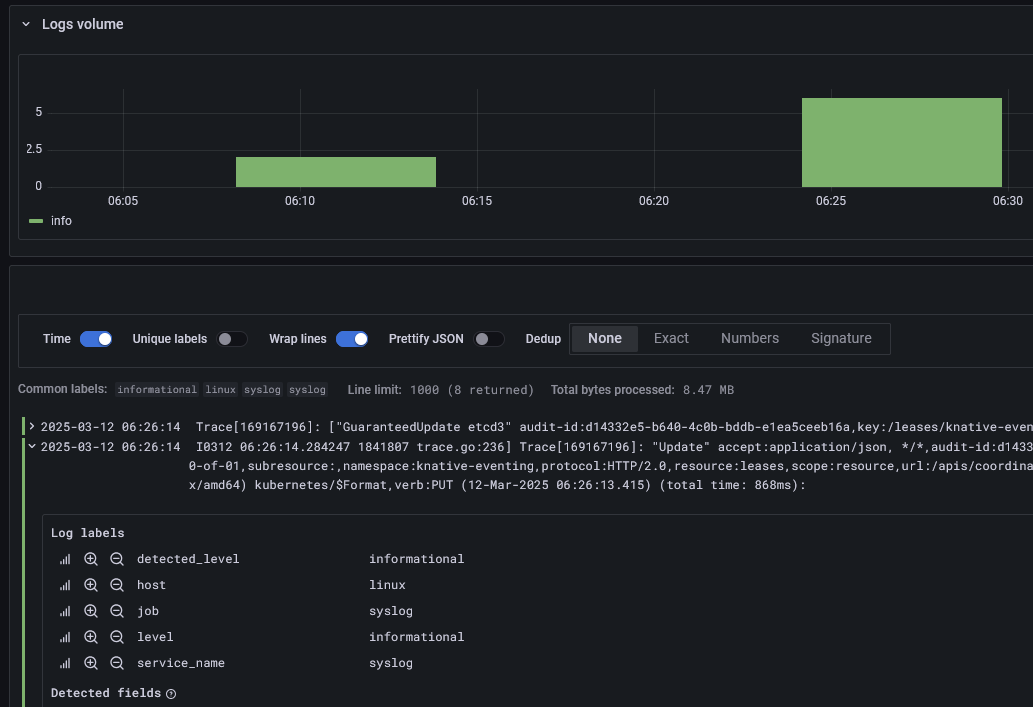
And this is what the outage looked like in Grafana#

Looking for a new opportunity as DevOps engineer
I am currently seeking a new opportunity as a DevOps Engineer, available from February 2026. I am open to remote or hybrid work from Prague, Czechia (Europe), for a long-term, full-time position or B2B contract - 300 EUR / daily. Please feel free to contact me for further details. You can also review my professional background on my LinkedIn profile.